Info
© 2026 Feels Co.
 Summary & key points
In the hit poker movie Rounders (1998), soon-to-be dropout law school student Mike McDermott is facing a stressful poker game against Teddy KGB, a Russian mobster with his own poker club. Mike previously lost his funds to Teddy KGB and has loan sharks after him. During the final poker showdown between the two, Mike is folding good hands because he notices that Teddy KGB has him beat when he splits open and eats an Oreo cookie. This cue allowed Mike to dominate most of the hands until Teddy KGB figured it out. The outburst indicates that the Russian realized his own tell. In using phrases like "Lays down a monster. The f*** did you lay that down. Should have paid me off ...," Teddy vocalizes his own inability to use cues, logical reasoning, and predictive consideration. This is reinforced by the expletives. Teddy KGB's self-admitted mistake after speaking in a confident manner demonstrates a near-bottom example of the Inference attribute.
Summary & key points
In the hit movie Watchmen (2009), scientist-turned-superhero Doctor Manhattan is doing a live, televised interview and is asked tough questions. Mainly, the interviewer suggests that the presence of Doctor Manhattan causes cancer in normal humans. Doctor Manhattan's responses analyze the nature of matter in a calm and collected manner. This was highlighted when Doctor Manhattan insisted that the chemical composition of a live body is chemically identical to a deceased one. His regard for the human condition as a matter of chemistry reflects the absence of the Sensation attribute.

Summary & key points
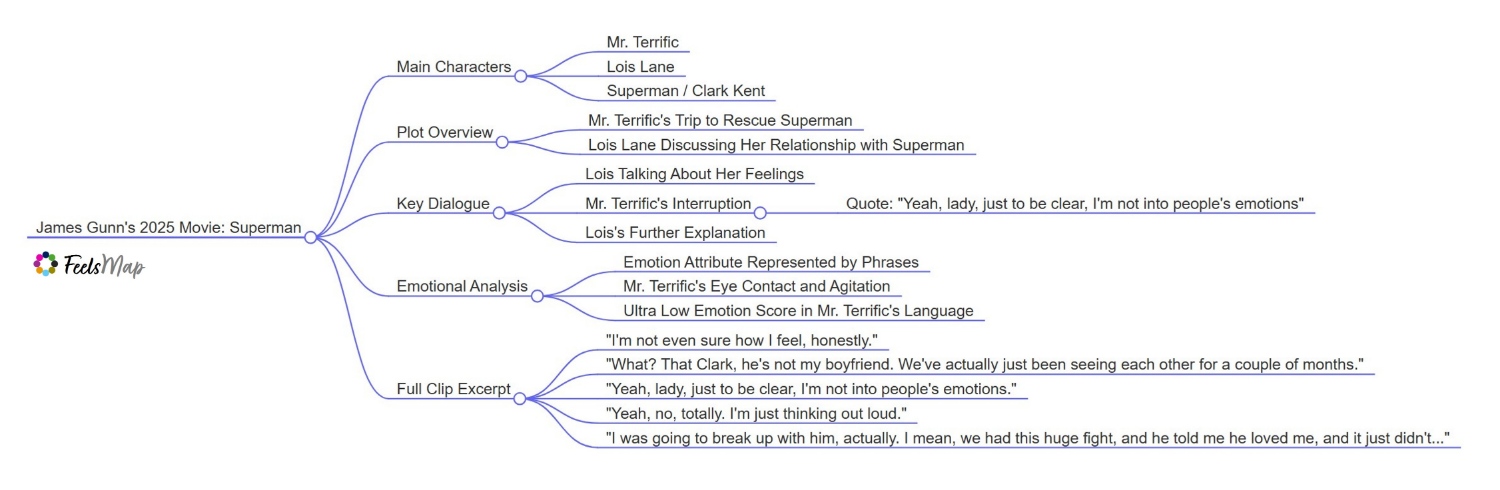
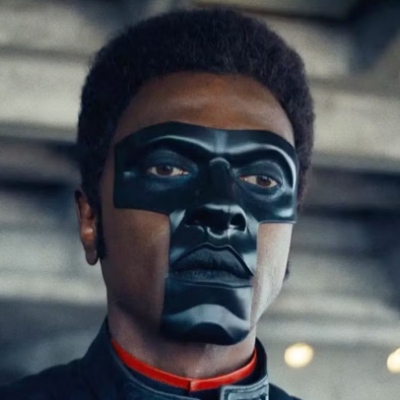
In James Gunn's 2025 movie Superman, Mister Terrific joins Lois Lane on a mission to rescue Superman. During their conversation about Lois' relationship with Clark Kent, Mister Terrific interrupts, stating, "I'm not into peoples' emotions," accompanied by intense, penetrating eye contact. This lack of interest and emotional expression reflects the Emotion attribute.
 Transcript
Follow along using the transcript below or move to side panel.
Showing transcript on side panel. Move transcript here.
0:01
Felicia @ Feels
Yeah, lady, just to be clear ... I'm not into peoples' emotions.
0:05
Felicia @ Feels
Yeah. No. Totally ... I was going to break up with him actually. We had this huge fight and he told me he loved me and it just didn't ...
0:13
Felicia @ Feels
In James Gunn's 2025 movie called Superman, comic book character Mister Terrific embarks on a trip to rescue Superman alongside Lois Lane.
0:22
Felicia @ Feels
As Lois started chatting about her relationship with Superman, or Clark Kent, Mister Terrific interrupted Lois and said:
0:27
Felicia @ Feels
"Yeah, lady ... just to be clear. I'm not into peoples' emotions," and proceeded to stare at her intensely.
0:33
Felicia @ Feels
Phrases like "I'm not into peoples' emotions" represent the Emotion attribute and Mister Terrific's direct eye contact with high visibility of the sclera, or white part of the eye, represents his agitation.
0:45
Felicia @ Feels
That's why Mister Terrific's language reflects an Ultra Low score in Emotion.
0:49
Felicia @ Feels
Here's the full clip.
0:53
Felicia @ Feels
I'm not even sure how I feel, honestly.
0:54
Felicia @ Feels
What?
0:56
Felicia @ Feels
About Clark ... he's not my boyfriend. We've actually just been seeing each other for a couple of months ...
0:59
Felicia @ Feels
Yeah, lady, just to be clear. I'm not into peoples' emotions.
1:03
Felicia @ Feels
Yeah, no, totally. I'm just thinking out loud. I was going to break up with him actually. I mean, we had this huge fight and he told me he loved me and it just didn't ...
 F
Feels Map
See the logical linguistic relationships in this Feel.

Summary & key points
Watching football is not the same without a refreshing beverage. That's why we ❤️ when we get videos like these from our awesome customers.
Summary & key points
In season 1, episode 2 of the hit HBO show called Silicon Valley (2014), venture capitalist Laurie Bream is having a meeting with her subordinate, Monica. Laurie lets Monica know that she may sit down if she wishes, although Laurie will be standing. Laurie then switches between sitting and standing, repeats herself, and misses Monica's obvious body language cues. This inability to adapt to the language and behavior of others demonstrates the Apperception attribute.


Summary & key points
LINGA is a psycholinguistics technology company that provides authorship identity verification as a service via our proprietary Linguistic Fingerprint™ technology. Through the LINGA web application, guests complete writing prompts in order to build their Linguistic Fingerprint™. Once built, guests can discover their true selves as expressed in the form-factor of writing. Guests can also scan written documents in order to generate a unique Authorship Verification Certificate, which is certified by LINGA and available as a downloadable PDF file. This certificate indicates whether or not the scanned document matches our guest's Linguistic Fingerprint™, and is backed by our $1,000,000 Authorship Integrity Defense Guarantee (SM · Terms apply). Individual guests can use LINGA to verify and defend authorship integrity for important written works like books, articles, papers, speeches, and more.